background
Below are some examples of graphics I developed during my time with 5NEWS in 2022 and 2023. During my time at Purdue, I was able to get in front of a camera during the pandemonium of COVID on a college campus. This was massive in the development of my on-air presence, but my graphics during that time came from an excruciatingly slow process of toiling on PowerPoint until I came to a product that would suffice my broadcast. As I entered the world of professional local news, I was excited to finally dump my PowerPoint slides for WSI MAX and unleash my weather creativity.
To be fair, the process of learning WSI MAX was far from painless, but I used many of my early morning weekend hours to experiment and research what was possible. Much of my time at the weather desk in 2022 was spent experimenting and most of my graphics probably should’ve stayed off the air due to their simplicity, but I became more comfortable (with graphics and being on-air) by the start of 2023.
Below are an array of graphics that I am proud made it on air that I developed in the Spring and Summer of 2023. These largely focus on either optimization with the Forecast Editor to save time during early morning show preparation or being appealing to look at, in an aesthetic and scientific way. I began to strive to make every weather hit look different for every show and every morning and I can’t wait to continue this pursuit.
Hourly forecasts
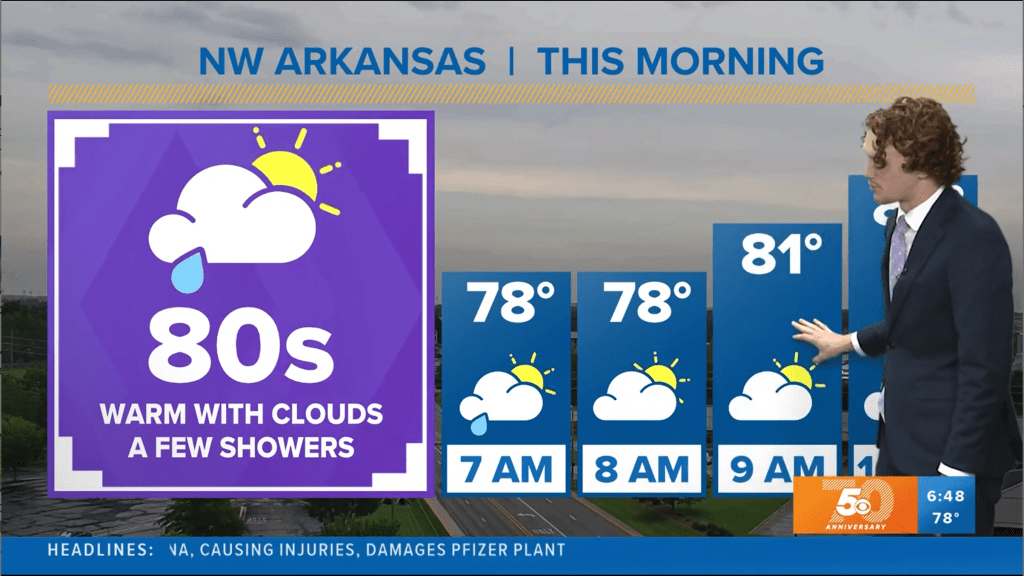
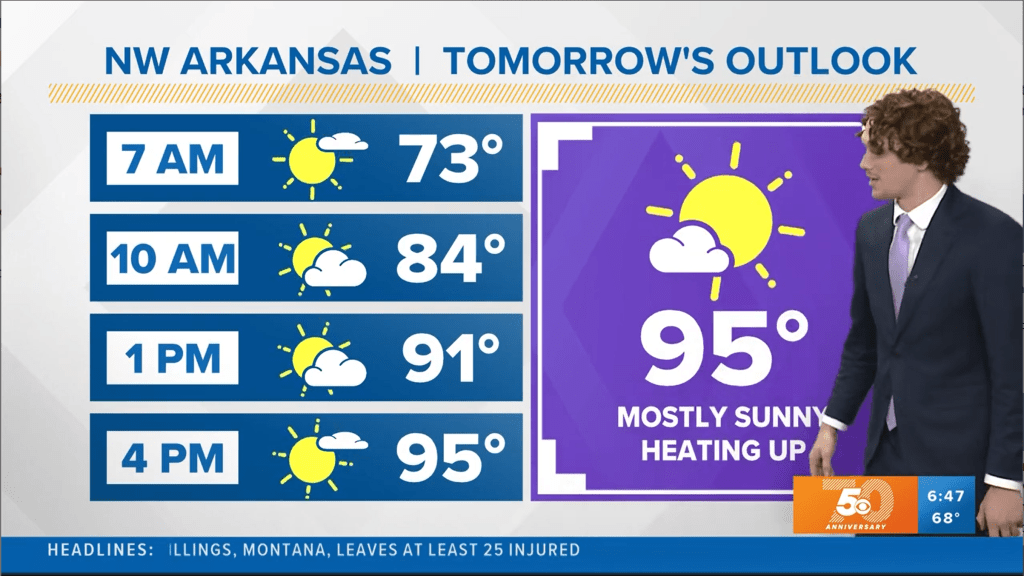
Hourly forecasts are the bread and butter of graphics for meteorologists outside of future radar and the seven day forecast. No matter the conditions outside, the season, or time of day, there is likely going to be some hourly forecast shown during a broadcast. So why not change them up! I spearheaded the creation of these two graphics that can toggle on/off a live camera and are completely automated so that the information being shown is accurate to your forecast (which helps minimize mistakes and speed up show preparation).
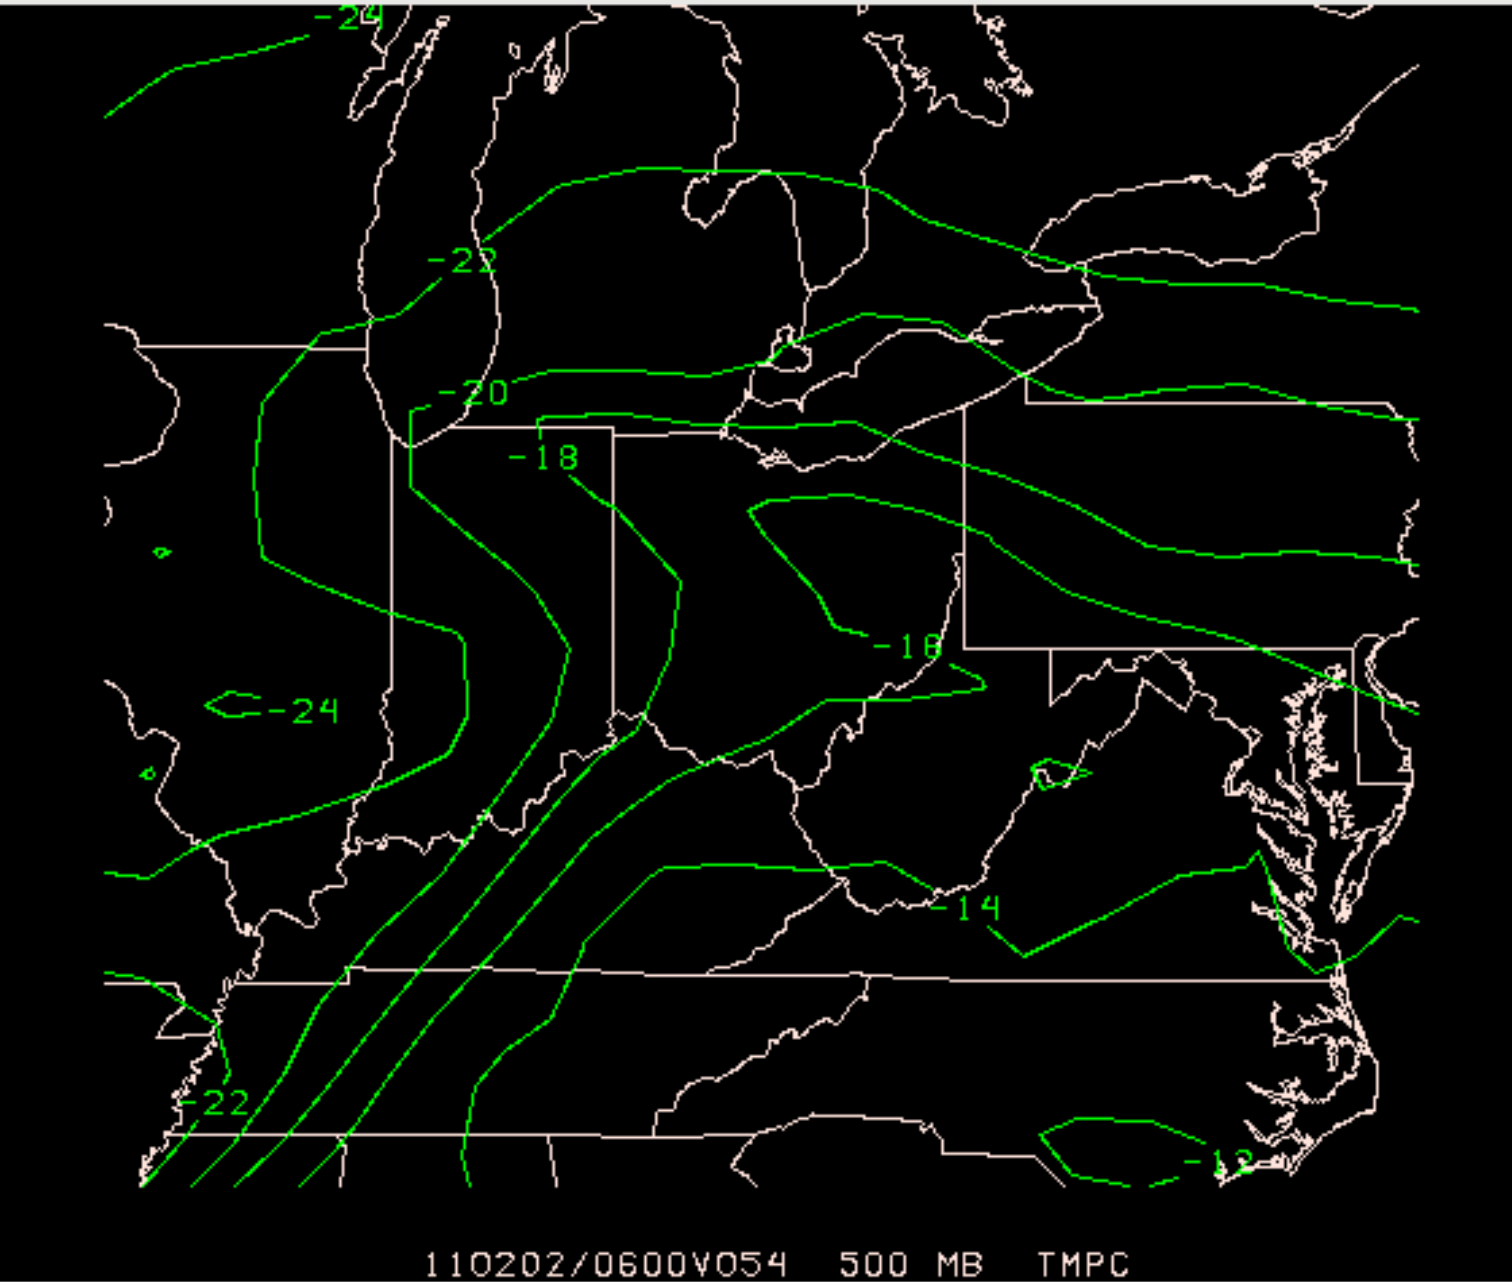
geopotential height and pattern map
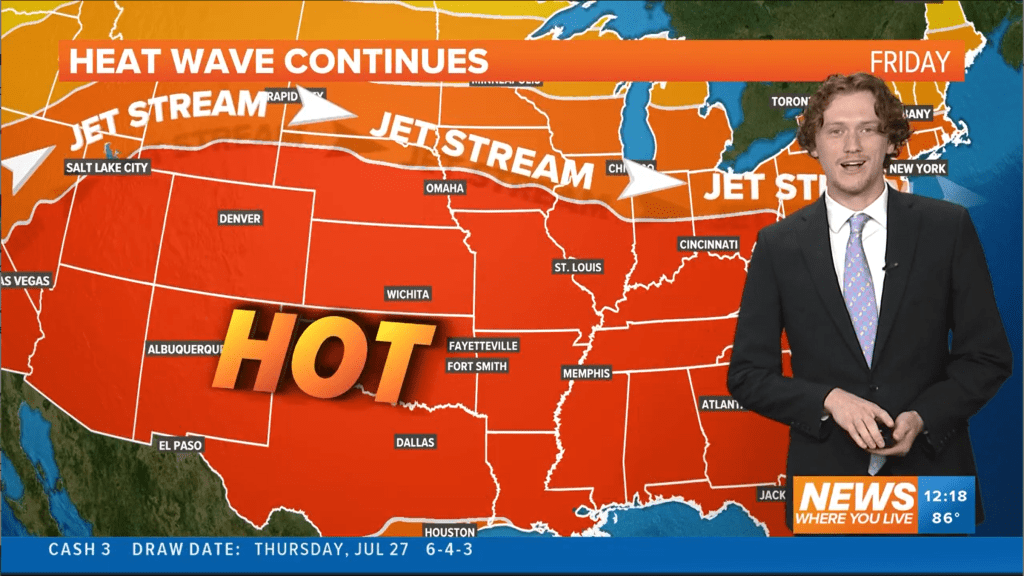
Apparently it gets rather hot during the summer in Arkansas and Oklahoma. And sometimes people aught to know why. This was part of the mindset behind creating this map scene. How to convey why the pattern is changing and when it is going to happen. This was a fun project as it forced me to work more with maps instead of just studio scenes which opens up more doors for creativity in the future.
Backyard and pool forecast
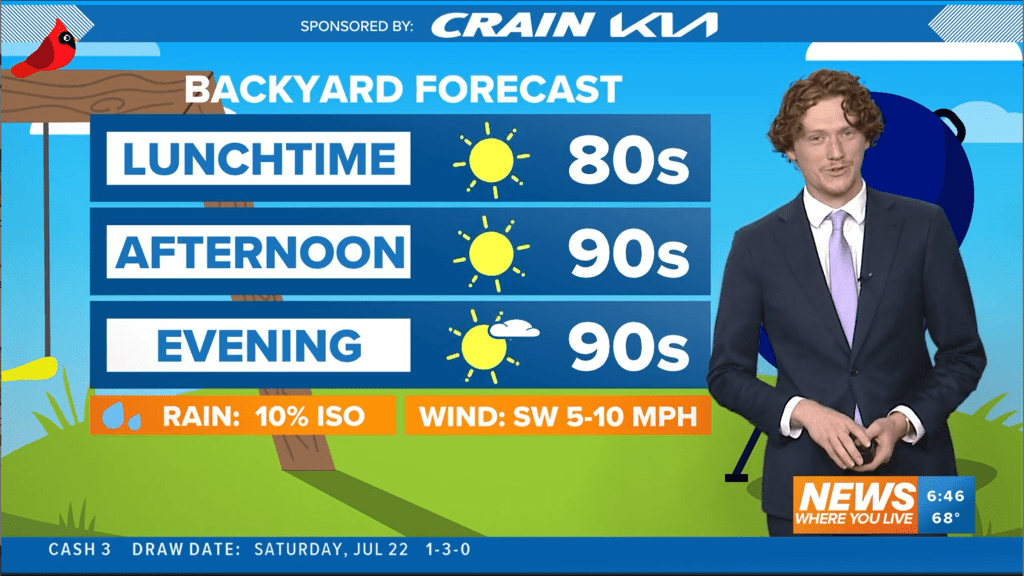
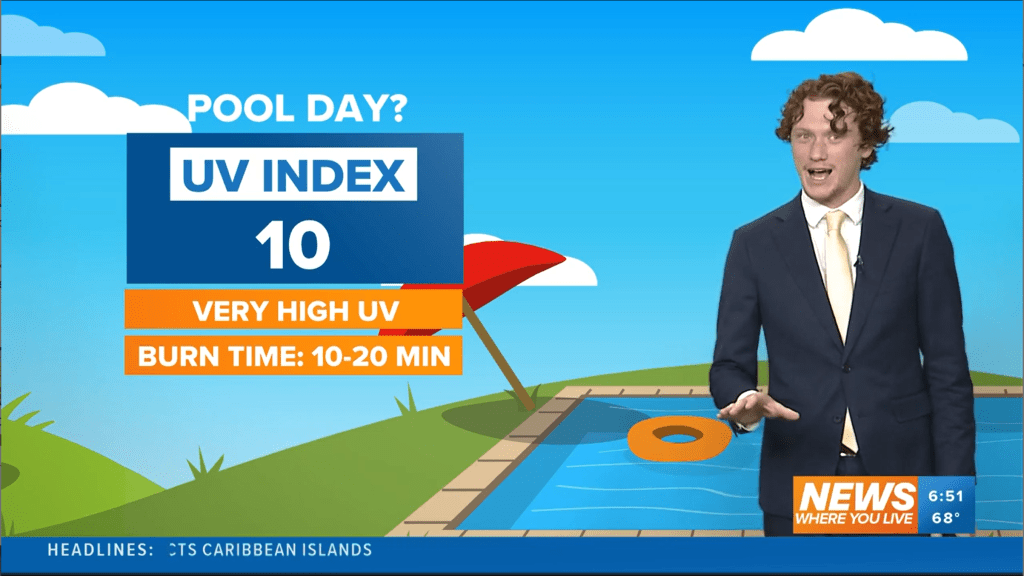
This was a hybrid graphic which was actually two parts that form one scene, but can be separated given timing and what story was being told. This graphic was one of my most creative, where I created the entire pool scene using different colored polygons and lines. The weather team ended using this specific scene for a sponsored segment that aired every weekday morning.
el niÑo graphics
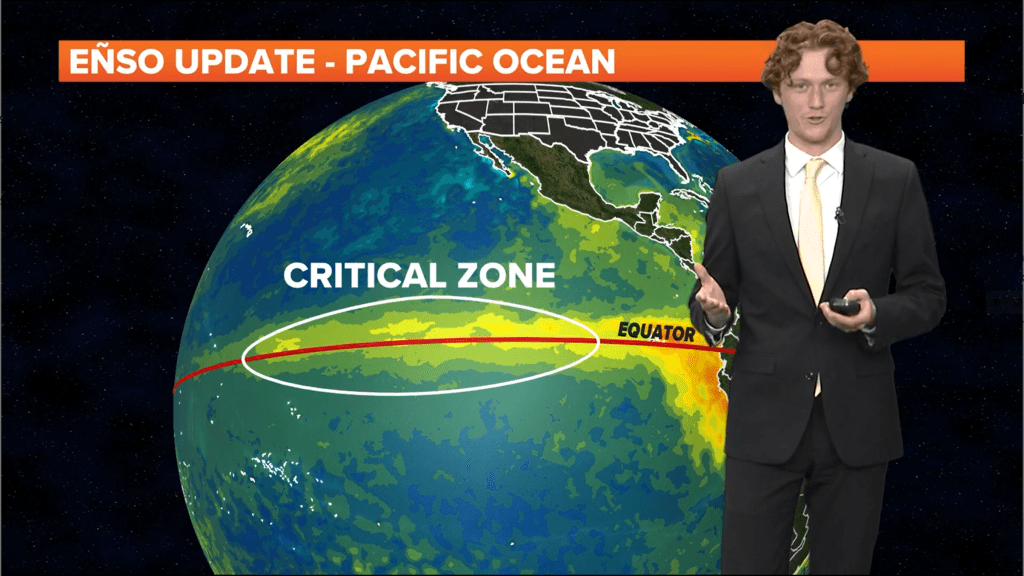
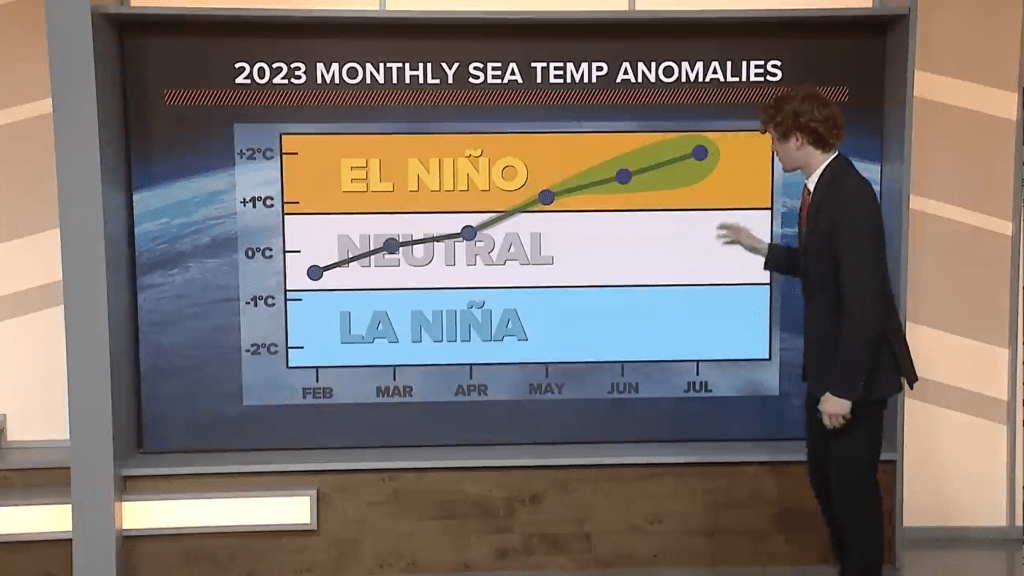
Specifically created for an El Niño Package, I liked working on these graphics since they were different than what I had done in the past. Instead of being oriented for repetitive use, these were a one-time deal and forced me to think outside of my traditional scope. The finished package ended up gaining over 78,000 views which made the time spent creating these from scratch well worth it.
supplemental graphics
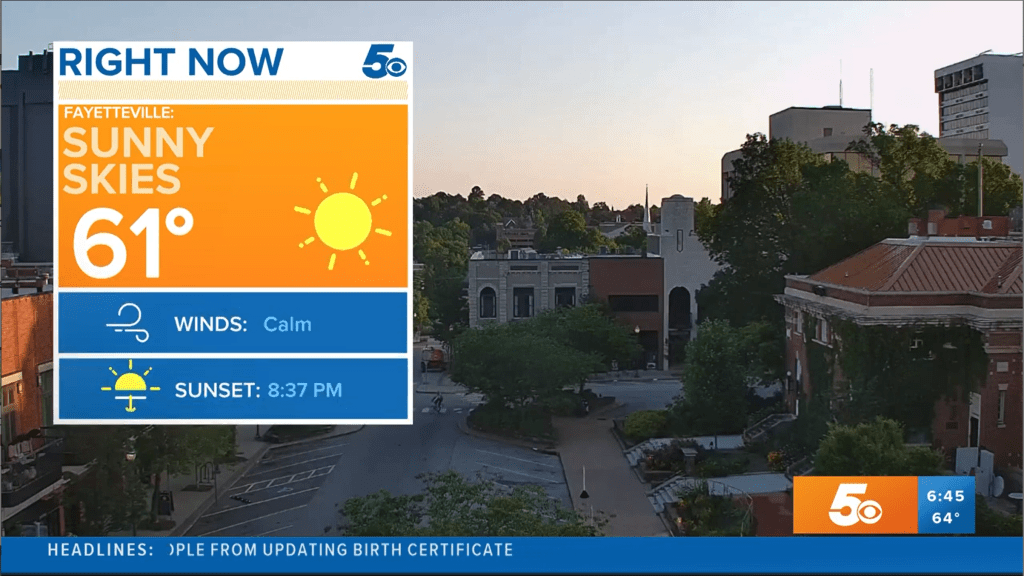
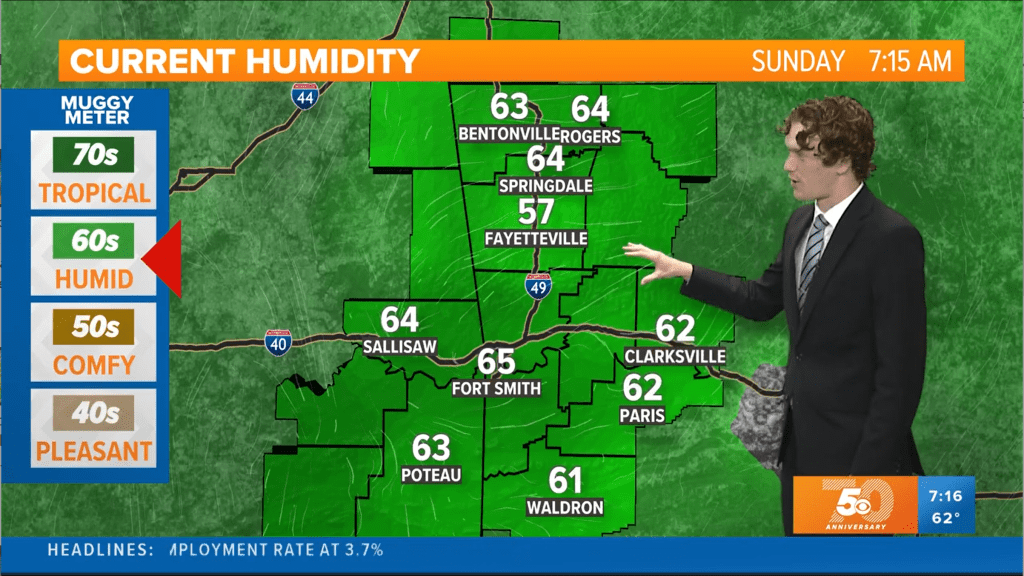
These two are additional elements to traditional graphics that I developed to give the audience a bit more information alongside the main graphic. I found I liked showing live cameras to begin some segments, so I personalized and automated a current chart for that location. For showing humidity, many people are not familiar with dew points and how it makes them feel, so I created an automatic meter to help give more context
